Weekly Review
The benchmark NIFTY 50 index ended the week on a negative note, closing at 24,565.35, down by 203 points or 0.82%. This marks the fifth straight week of decline, making it the longest losing streak since August 2023.
| Weekly Snapshot | |
|---|---|
| Open | 24,734.90 |
| High | 24,784.15 |
| Low | 24,535.05 |
| Close | 24,535.05 |
| Previous Close | 24,768.35 |
| Weekly Change | 203 Points (0.82%) |
| 52 Week High | 26,277.35 |
| 52 Week Low | 21,743.65 |
| Key Resistance | 24,950 |
| Key Support | 24,000 |
📉 Technical Trend Overview (IMRA Analysis)
| Trend Type | Direction |
| Long Term | 🔼 Up |
| Medium Term | 🔽 Down |
| Short Term | 🔽 Down |
🔍 Technical Analysis:

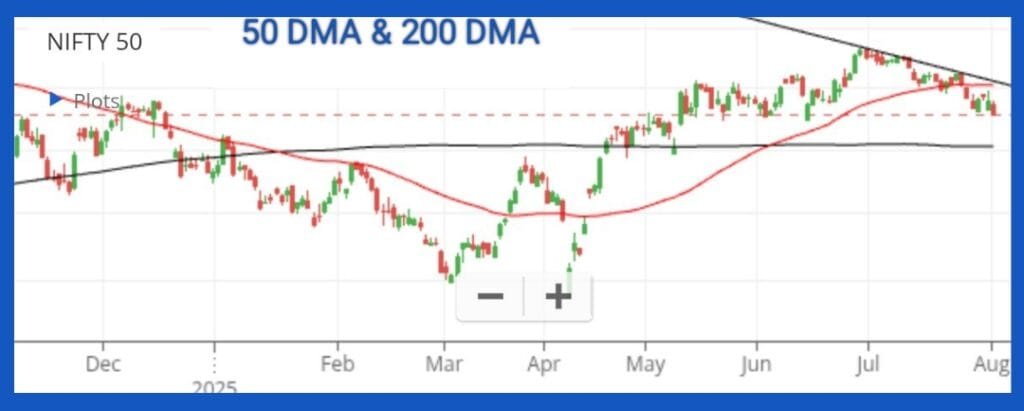
📊 Chart Description:
The chart displays the daily candlestick pattern of the Nifty 50 index. Overlaid on the chart are two key technical indicators:
50-Day Simple Moving Average (50 DMA) shown in red
200-Day Simple Moving Average (200 DMA) shown in black
🔹 Long-Term Trend (200 DMA-Based):
The long-term trend remains bullish as the current price is trading above the 200 DMA.
Additionally, the 50 DMA is positioned above the 200 DMA, reinforcing the strength of the uptrend from a long-term perspective.
🔸 Medium-Term Trend (50 DMA-Based):
The medium-term trend is bearish, as the price has slipped below the 50 DMA.
This signals weakness in momentum and is particularly relevant for swing traders, as the 50 DMA often reflects intermediate market direction.
🔻 Short-Term Trend (Trendline-Based):
The short-term trend is also negative, confirmed by the price staying below the descending trendline drawn from recent highs.
This downward slope indicates selling pressure in the near term and can be useful for traders looking for short-term entries or exits.
📌 Key Insights from the Chart:
- Support from 200 DMA: The 200 DMA is acting as a crucial support level, preventing deeper corrections so far.
- Pressure near Resistance: Despite holding above long-term support, the index is facing resistance from the falling trendline, indicating a possible consolidation or short-term correction.
- Bearish Crossover Avoided (So far): Although the price is below the 50 DMA, the 50 DMA itself is still trending above the 200 DMA — no death cross yet, keeping long-term investors on alert but not panicked.
- Mixed Signals Across Timeframes: With conflicting trends (bullish long-term vs. bearish short- and medium-term), caution is warranted, especially for short- and medium-term traders.
A Discussion on Trend Analysis
Despite the current weakness, long-term investors can remain optimistic. According to IMRA, the long-term uptrend remains intact. Short-term and medium-term corrections often align with broader trends eventually, and this could provide an opportunity for investors following a Buy-on-Dips strategy.
Nifty may see more consolidation or mild correction in the short term, possibly retesting levels around 24,500–24,000, but there’s no indication of a deep market crash at this point.
🌐 Key Reasons Behind the Decline
1. Global Market Sentiment
The broader weakness in international markets has weighed heavily on Indian equities. Uncertainty across global indices translated into lower risk appetite locally.
2. Foreign Institutional Outflows
Continuous selling by Foreign Institutional Investors (FIIs) has added to the bearish tone, reducing market liquidity and pushing prices lower.
3. Sectoral Weakness
Pharma stocks were hit hard, following concerns about potential US price control regulations. The Nifty Pharma index plunged by 3.33% on August 1.Defence, Realty, IT, and Metal sectors also saw noticeable drops.
4. Trade Tensions
Geopolitical uncertainties resurfaced after the US administration imposed a 25% tariff on Indian goods, as per The Economic Times. This move has reignited trade war concerns and rattled market participants.
5. Bearish Technical Signals
Weekly charts are showing bearish candle formations and long upper shadows, suggesting selling pressure at higher levels and lack of conviction from bulls.
🏆 Sector Spotlight
✅ FMCG stood out as the only major sector showing resilience. While others slipped, consumer goods stocks offered stability, likely due to steady demand and defensive nature.
❌ Other sectors, especially pharma, IT, metal, and realty, dragged the index down.
📊 F&O Market Outlook
Options data suggests a short-term trading range of 24,000 to 25,000. A breakout beyond this range (particularly above 24,950) could open the path for a recovery, while a fall below 24,500 may bring more weakness toward the 24,100–24,000 region.
🧠 IMRA’s Take: Strategic Outlook
- Investors are advised to stay cautious but not overly pessimistic:
- Short-term traders should watch the 24,500 support level closely.
- Medium-term investors may see trend reversal over the next few months to a year.
- Long-term investors are encouraged to continue accumulating quality stocks on dips, considering the upward bias over a 3–5 year horizon.

